Students generally assume that curving means an upward adjustment of low test scores, but the basis of the practice derives from assumptions about statistical distributions of scores (bell curve). If you assume that scores should fit a normal curve, then it makes sense to "normalize" them so they fit under a normal curve. Normalization also requires that overly high scores be adjusted downward for conformity. Either way, data are distorted and some information is lost. Look at some data, then consider all the implications of "grading on a curve".
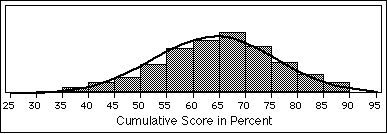
A sample can provide perspective for students who are trying to understand the vagaries of performance and rewards. The following graphics summarize data from 422 students who finished the course, Biol 222 Vertebrate Organization over a 15-year period. These are self-selected students in a course at a selective college; they do not represent a general population. Also, students, courses, exams, even the teaching of one professor vary with each year.

The line shows the infamous normal distribution, the "bell" curve. This sample is large enough to describe a fairly even curve. The average is 65. Absence of individual averages in the 90's suggests that I am indeed a hard grader (or that I am living up to my goal of challenging students). Notice that the distribution of students is skewed toward the higher end of the curve, but then Hamilton students are intelligent, and they are good workers. Professional educators suggest that results should fit "the curve", and in this case that would mean curving grades down. Most students would probably not welcome that practice.
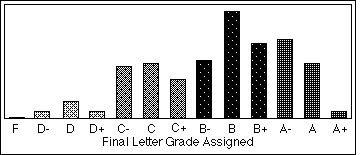
Compare the chart of grades below to the chart of cumulative scores above. What do you see?

I resist distorting class perceptions by "curving" each test score during the term, but the final assignment of grades suggests they are effectively "curved". There are no averages at 98%, but a few students received A+. A few students failed. If a student fails to complete the work there is little choice in evaluation of that work. Fortunately, most Hamilton students are good workers who use their intelligence. I try to recognize student improvement and an individual's rise to a challenge when I assign final grades.
What does a percentage mean?
A percentage shows how much of a particular exam was dealt with successfully, but what test is so perfect that it could completely determine extent of knowledge or ability? If a student gets a grade of 90%, it does not mean they know 90% of everything in the subject. Wise students will begin to look at scores as a place on a continuum of achievement rather than analysis carved in stone.
Averages in my classes may be in the 60% range. Nineties are rare. I am not alarmed by apparently low numbers, but these scores do tend to worry conscientious students who are conditioned to think in terms of 90% = A, 80% = B, etc. This can undermine class morale, and low class morale can undermine student ability. That does concern me, so I offer some suggestions for dealing with these anxieties.
Do not expect to be graded solely in comparison to your classmates, but you can use the class data to infer your general standing in terms of what your class is doing. Where are you relative to the class mean? For example, if you have a 72% average, but the class average is 52%, you are doing better than your score might suggest to you. Adding 20 to each number would make the class average a traditional 72% and give you a very respectable 92%. This is a form of "curving" you can do for yourself with each examination. Simply look at the class mean (which is always presented) and adjust it to fall into the 70% range then apply the same correction factor to your score or cumulative average. You can do this in any of your classes if basic information is provided, but there is a limit to this approach.
Expecting to be graded solely in comparison to your current classmates is simplistic, even naive. Thoughtful professors use the perspective of years of experience to consider what students can do. Do not assume, that every class will have a certain percentage of A's or F's. You might be a strong person in a relatively weak group, or you might find yourself in fast company. The situation of each class becomes apparent as the semester progresses. Sometimes there are no A students -- often there are no failures. This is also a real-life view of how work is evaluated that is not unique to professors and exams.
Grades should mean something more than flattery. Grades speak to the world, not just to classmates, parents or a campus. Eventually performance shows and counts, and must be competitive on the merits. I encourage students to sharpen skills now by selecting challenge. You, and your family, are paying a lot for a real education. When you evaluate courses (or colleges) consider that thoughtful professors do not give grades, they assign them on the basis of the evidence provided by a student's work.
Grade inflation is not as flattering as most students would like to believe. Grade inflation lowers standards, discounts achievement and hurts students in the outside world more than students realize. The grades in my example, like the grades of most colleges, are skewed toward the higher end of the curve. Average is a definition for C, but college averages based on grades assigned are no longer C. In 1990 averages were more often B, and they were moving toward A- in 2005. Reports from shared institutional research in 2015 gave an average grade of A at many prestigious colleges. If 80% or 90% of students receive a grade of A, or graduate cum laude (as reported at some Ivy League schools), what does that tell you about challenge and standards? How much did those students grow during their college years? Did those students obtain an education, or just a credential? Consider how much an inflated credential is worth when future evaluators do not see the ability that inflated grades led them to expect. Grade inflation does no favors for either students or our society.
There is evidence that students are not always deceived. Students with standards and the willingness to apply effort for real achievement resent a pass-fail system that assigns them the same final evaluation (pass) as students who give considerably less effort and produce a lower quality result. Letters of recommendation, if they are read, might offer insight that numerical evaluations no longer provide, but in a society where test scores seem to be the dominant currency, we need to consider what numbers really mean.
Some data that are available on the web have been gleaned and compared in some nice graphics at gradeinflation.com. The author of that website published related thoughts in the CSMonitor 2009 as "Grade inflation gone wild".
Supportive arguments for the practice of grade inflation often cite a student's acceptance at a selective school, required effort, or concern about harming students with lower grades. If these are now the criteria for grading, then the professoriate is abdicating an important responsibility. Students presumably chose education for help in improving themselves. On what long-term basis can student-customers identify real standards? Do students bear any responsibility for the consequences of minimal efforts? Do faculty really intend to stop evaluation at an admissions office, and before students enter a class? Is there no harm done to graduates who do not succeed because they were not taken seriously or because they did not realize that they were seen as unprofessional? Perhaps we need to be asking just what it is that we expect education to be doing beyond entertaining young people and keeping great numbers of them away from employment for several additional years.
________________
Footnote: This is an expanded and periodically updated version of what I originally wrote in 1990 to help my students understand some of the thought that can go into grading. Once I posted this on the web, appreciative e-notes arrived periodically from other teachers all over the county. It is good that this helps support other teachers in their desire to encourage quality. Unless evaluators consider the implications of their actions, and those being evaluated understand the long-term implications of having no standards, the general quality of work in our society will continue to reflect declining standards.